Setting sail on the R/V Falkor a few weeks ago to explore unknown features in the Pacific Ocean led us to consider the Lewis and Clark ExpeditionThe Essential Man
“Bill’s work is essential,” USGS scientist and cruise leader Amanda Demopoulos commented. “He’s not only collecting data to create better maps of the seafloor, but he’s also finding both plumes that have been seen in the past and discovering new ones for us to visit.”
“Oh yes, Bill has been a tremendous help,” agreed GEOMAR scientist and resident bubble expert Jens Greinert. “Each night before I go to bed, I check with him and discuss targetsNight Watch
Navigating the corridors of R/V Falkor on most days, you will not see Bill out and about. That is because he runs the Night Watch, monitoring the screens and instruments of the Falkor while the rest of us recover from the day’s research. It might seem lonely, but Bill does not mind.
“I actually prefer the quiet,” he says. “There’s a certain serenity to monitoring the screens while all you hear is the creaking of the ship and the lapping of the waves. The only hard part is the beginning and end of each cruise, where I have to get on and off the daytime sleep schedule.”
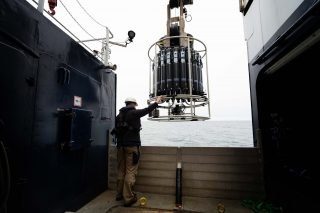
And Bill’s mapping work is not the only activity taking place at night. R/V Falkor never truly rests. In addition to overnight seafloor mapping and water column imaging, the ship often conducts water column Conductivity, Temperature, and Depth measurements (also known as CTD) at night. When all this information is combined, it provides a rich background canvas on which the specific information from various seeps can be added as detail.
Multibeam Mapping
Our tools for mapping the seafloor have advanced considerably from the lead sounding lines
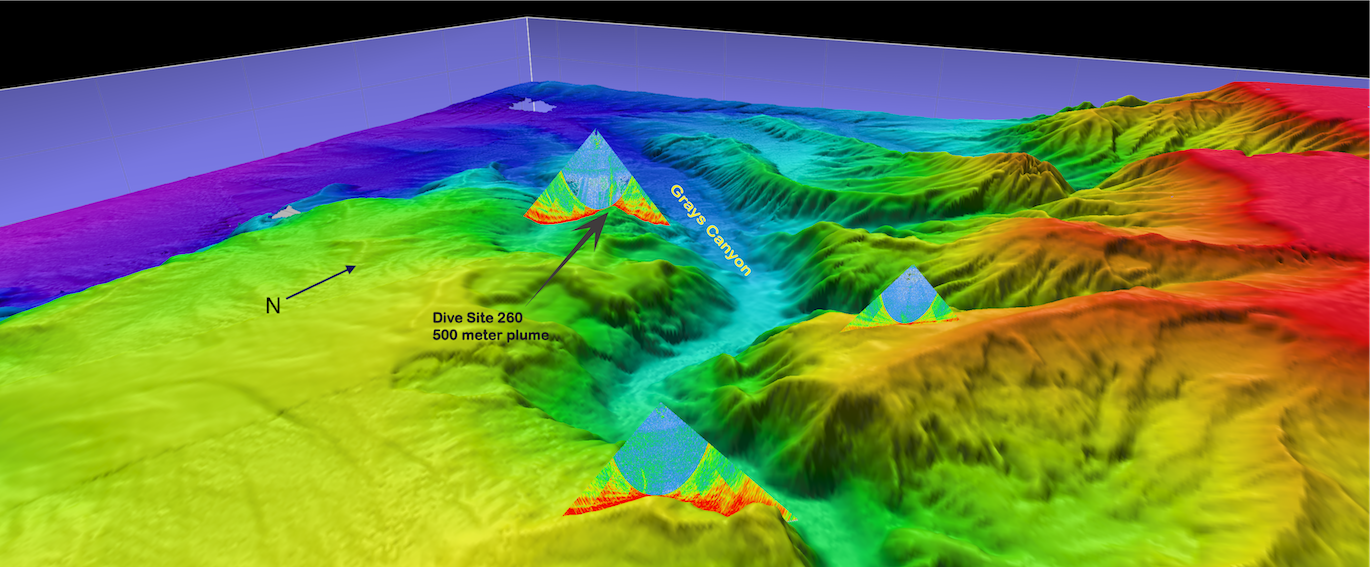
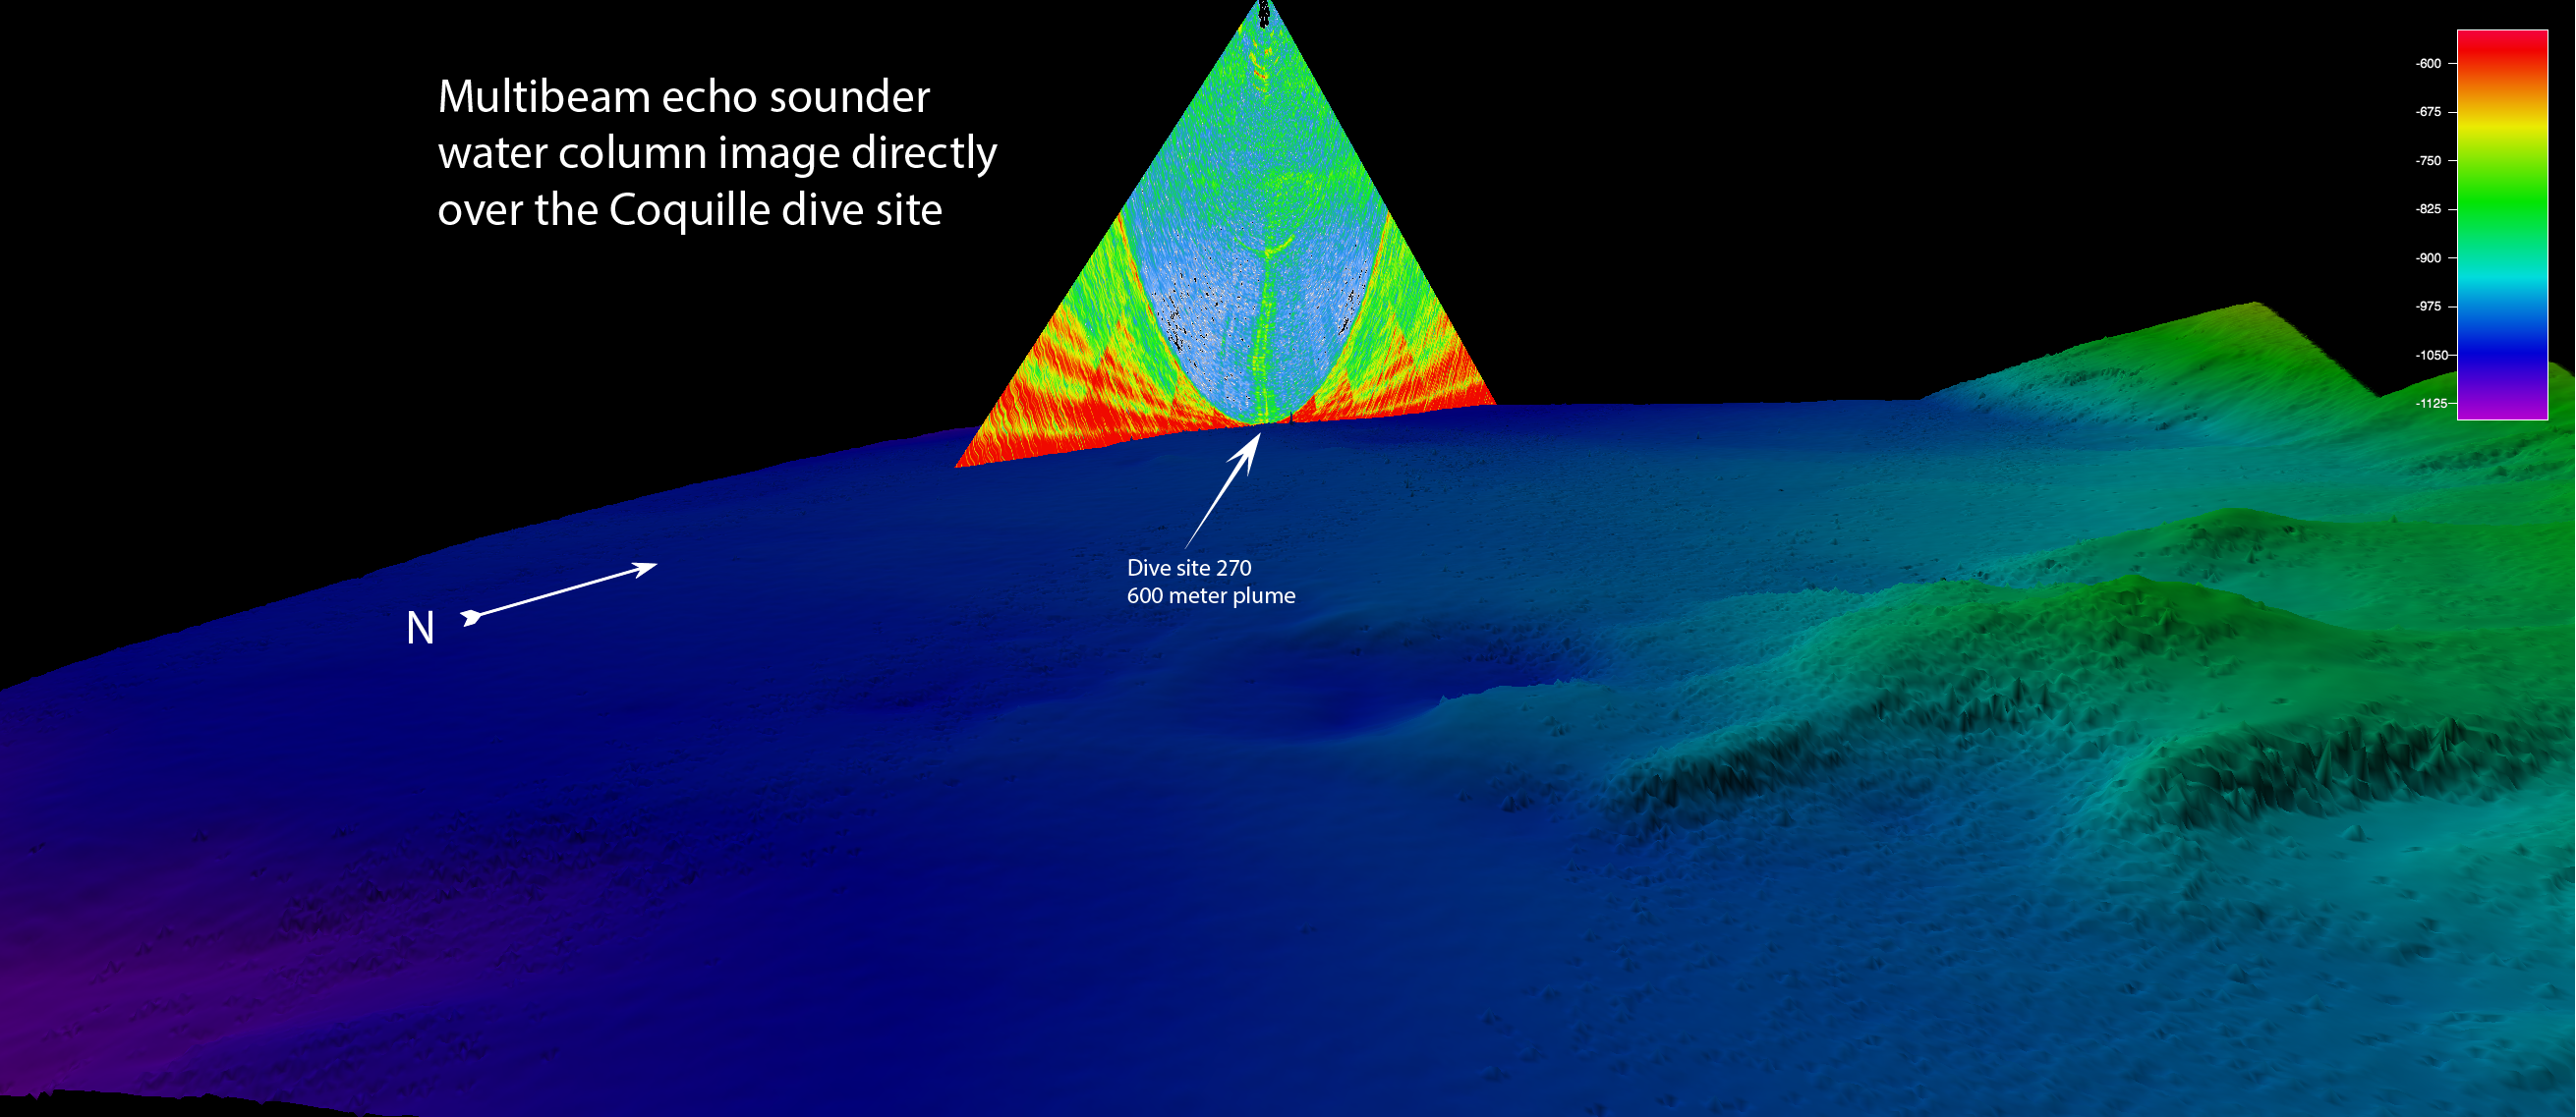
“The multibeam works by sending out a narrow fan of sound energy perpendicular to the ship's track from the hull of the ship where the multibeam echo sounder is installed,” Bill explains. “As each fan of sound energy hits the seafloor or something in the water column, it bounces energy back to the ship and the computer makes images from the readings. My job is to interpret the images and figure out which sites to recommend for further surveys or ROV dives.”
The primary use of the multibeam is mapping the seafloor and its roughness, but the instrument can also image the water column. Bill uses the water column images to search for methane bubble plumes, also called flares, which are emitted at some seafloor seep sites. The stronger the flare signal, the more attractive the site. Sometimes, it is a matter of choosing amongst a veritable smorgasbord of options.
“Astoria Canyon had dozens of flares, and the canyon itself is well mapped, so that one was easy,” Bill said. Other locations have not proved so cooperative.
“The biggest challenge is seeing flares on the screens at night and identifying the potential seep locations, only to learn that the other scientists found no methane emission at the seafloor during the next day’s ROV dive,” Bill points out. “We’re seeing that seeps can really change over time, with processes like tidal fluctuations affecting how many bubbles come out. So I can see a place with a strong signal, then 6 hours later, the ROV is hunting around trying to find even one or two bubbles.”
Still, that information about the changes in seepage with time is valuable. Since part of what we are out here to learn about is how these seeps function—what fuels them, what governs the rate and frequency of their bubbles, and how much gas escapes them—knowing that there is change over time is useful. After all, that is part of what Jens and Tim