



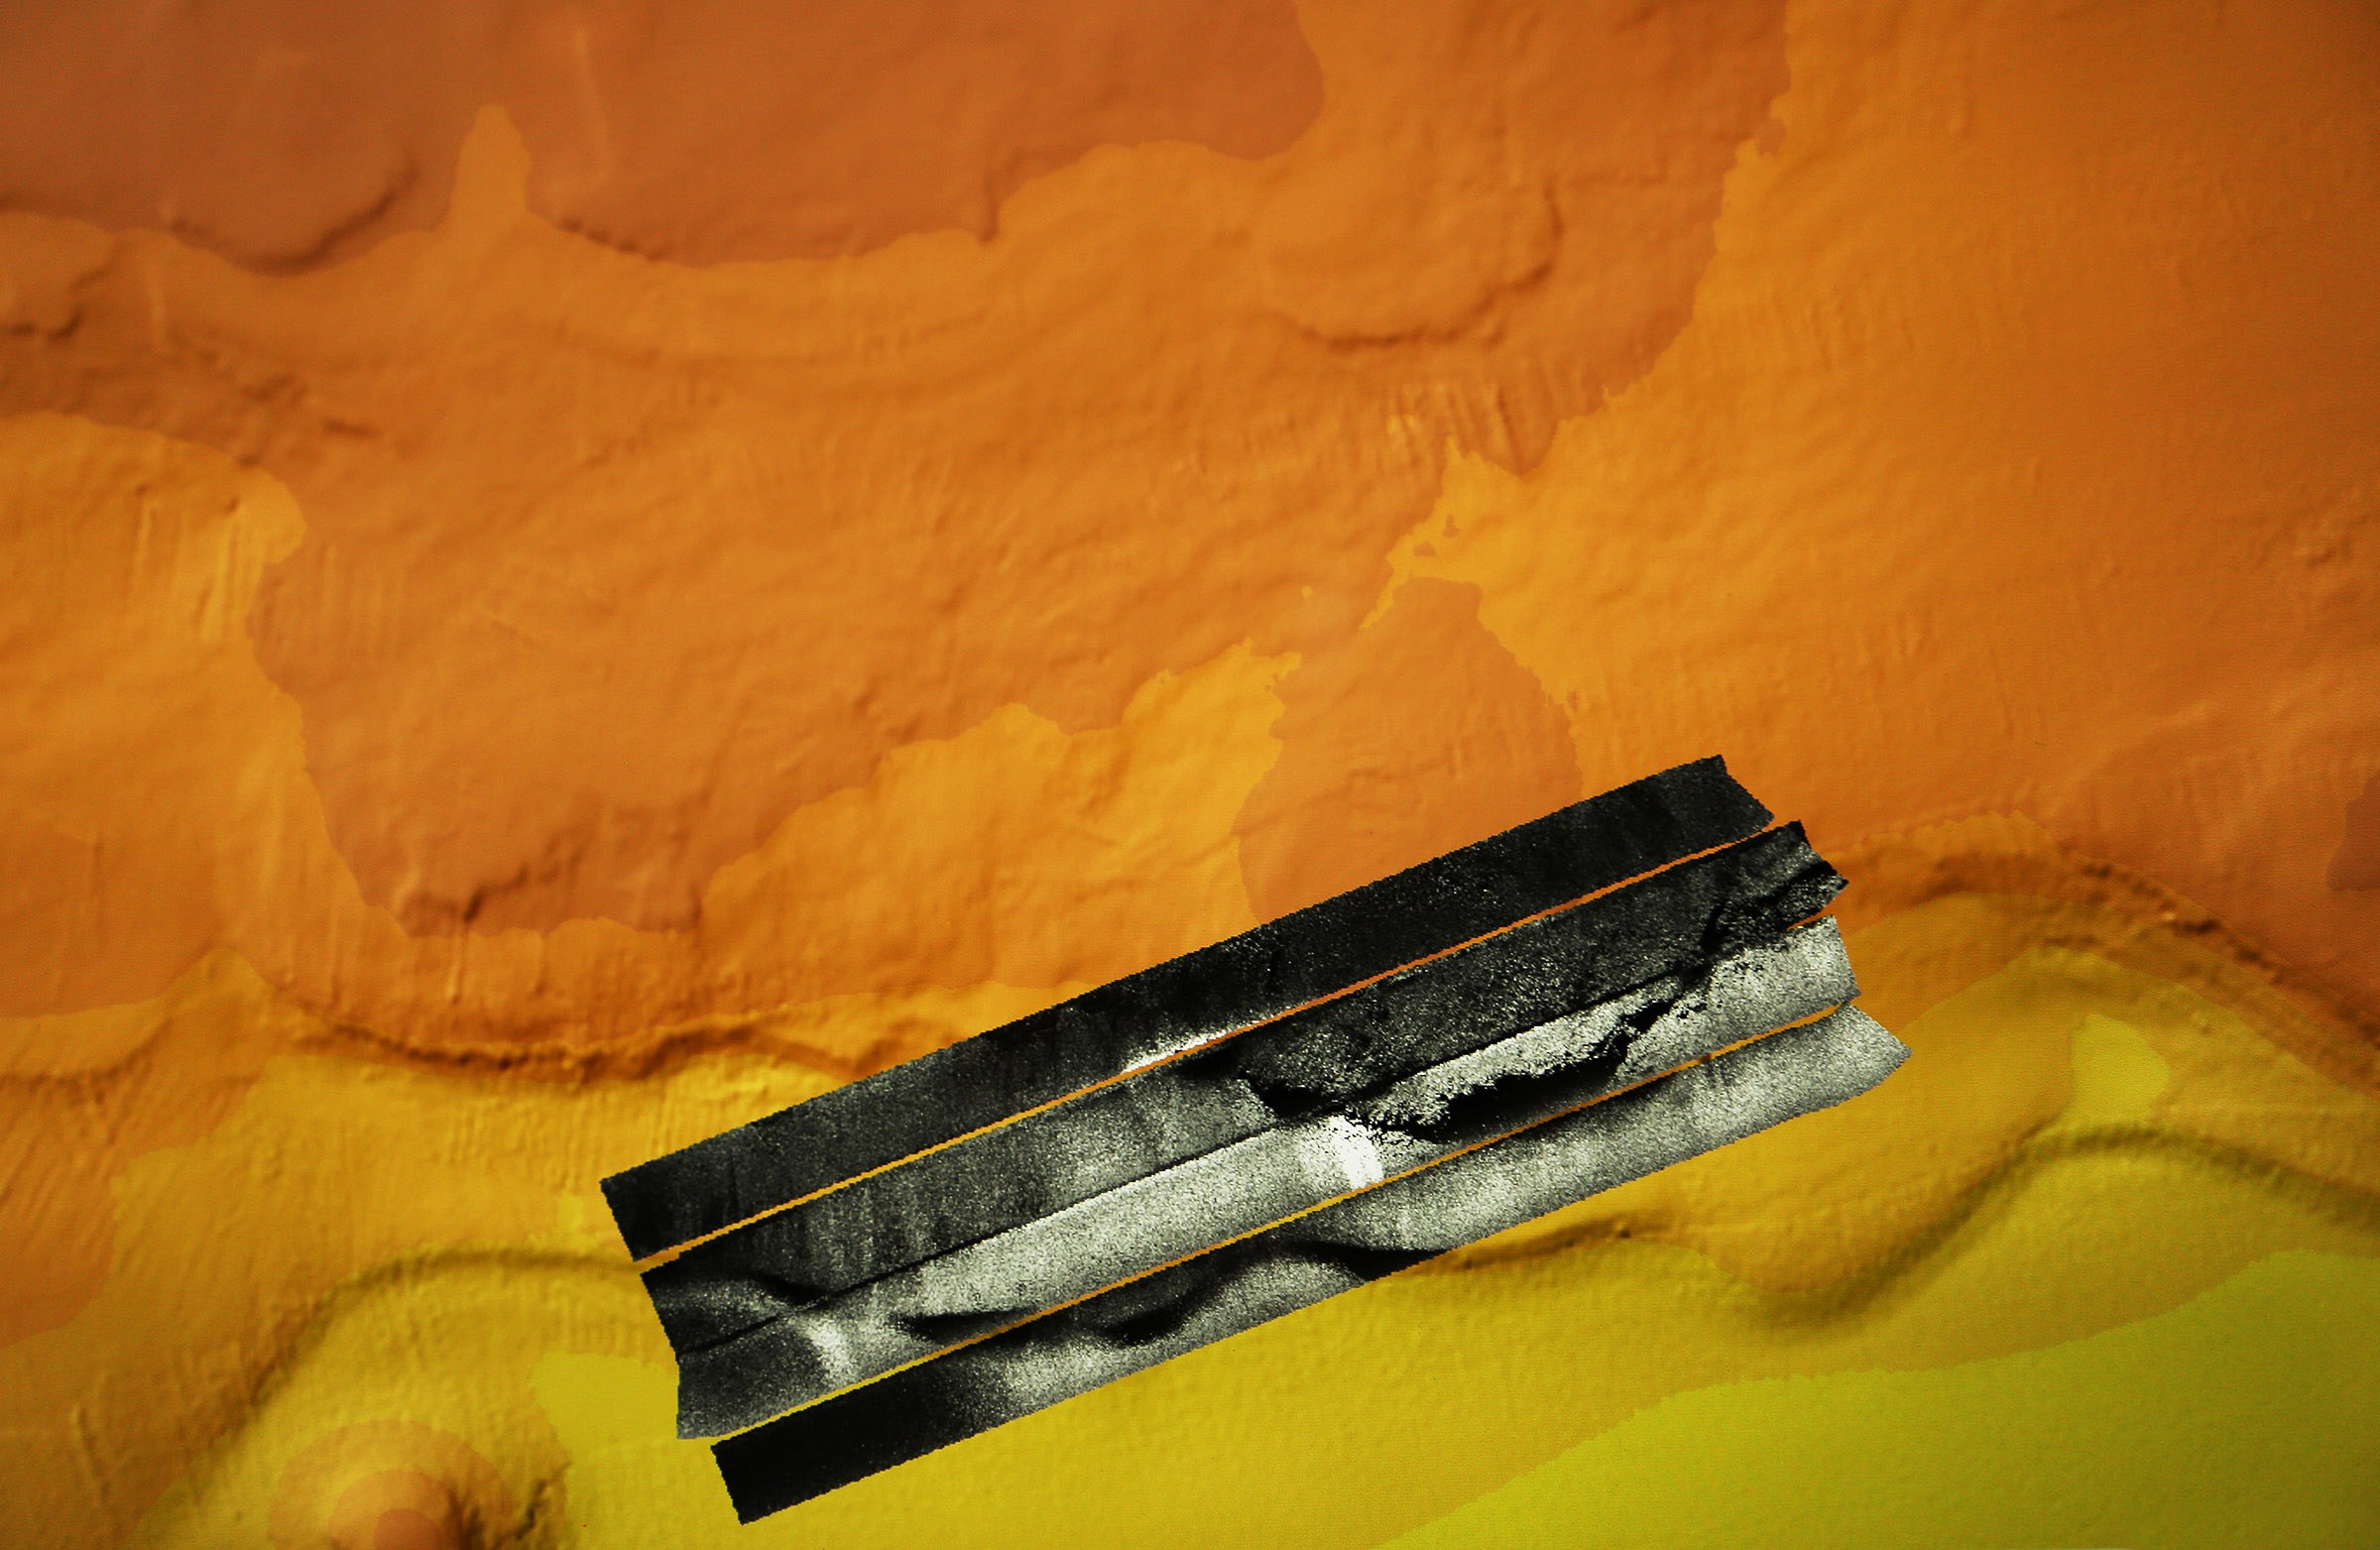

This work is more than reconnaissance - in fact, much more. We want to know about what is on the seabed. What does it look like? What is it made of? Is it worth the immense time, effort, and cost to return to any particular area with a Remotely Operated Vehicle (ROV) to gather further information?
On leg 1 of the Sea Level Secrets cruise
Sequence of Events
My first step is importing the data from the AUV into processing software and running various corrections. The first correction is needed because the transducer (transmitter and receiver) is at an angle to the seabed, resulting in the swath of sound traveling at a shorter distance closer to the vehicle and a longer distance further away from it. This means that the image created by the sounding intensity captured is distorted, as the signal (the returning sound pings) furthest from the transducer will be weakest - it has the most medium to travel through and be attenuated by (absorbed and scattered). Since this phenomenon is thoroughly understood, we can use a correction tool that filters the sound signal, computing the time it takes for sound to travel through the water at different distances along the swath.

Next, I will need to help the processing software properly identify where the water stops and where the bottom starts. It does a pretty good job of doing this itself, but rapid changes (rocks) and the occasional fish can throw it off.
Once the location of the bottom is finalized, I can run further processing on the sound that returns to the transducer from the bottom. We can normalize the signal (increasing weak signal and weakening strong signal) and I do this by applying an empirical gains function that looks at every single ping's location, creating a function which evens the signal out.
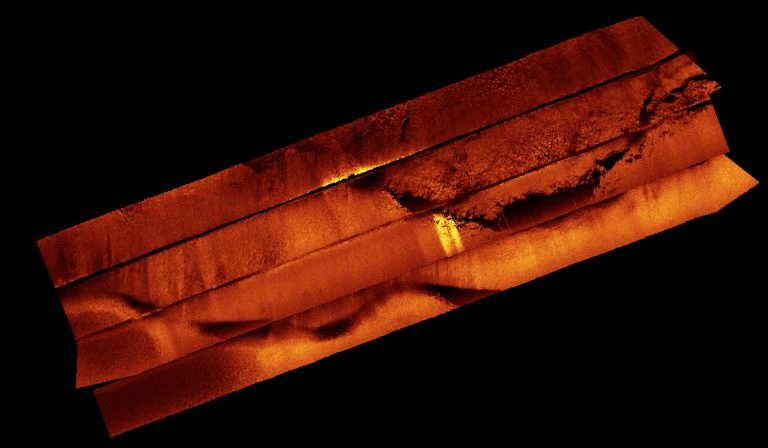
Finally, I crop out the edges of each swath to only show the areas with good data, and then layer them in order, creating the most continuous mosaic of the seabed possible. I export my final image as a special kind of image file that has the location of the image embedded in the code, so when it is opened by my colleagues on any kind of other geographical information system (GIS), it appears in the correct location on the globe. My colleagues use the images that I have created to help understand the structure and type of seabed, which makes better informed decisions on where to target ROV work planned for the next leg of the cruise and put those samples and observations into the context of the whole reef.
Combining Outcomes
Once the sampling process is over and the corals have been dated, we will match the coral age and type with what they look like on side scan imagery. Mapping the whole reef with the side-scan sonar will allow us to see how the whole reef responds to rising sea-level. We expect to see bands of corals of similar ages across our maps, as well as changes in the types of corals present at different depths. These bands will indicate how the reef grew and what it looked like at past sea levels. Knowing when sea levels changed, how fast, and by how much, will improve understanding around the world of future climate change on our coastal communities and the corals.