




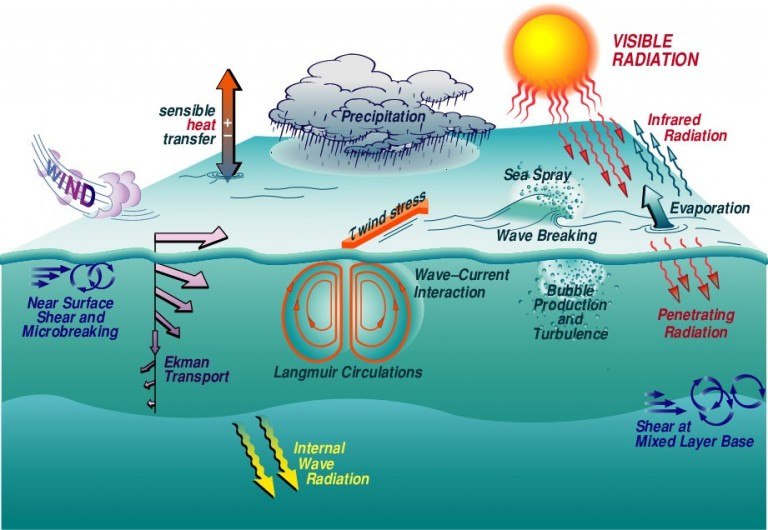
Two focal pieces of equipment are being deployed from Falkor during the Mixing Up the Tropical Pacific cruise
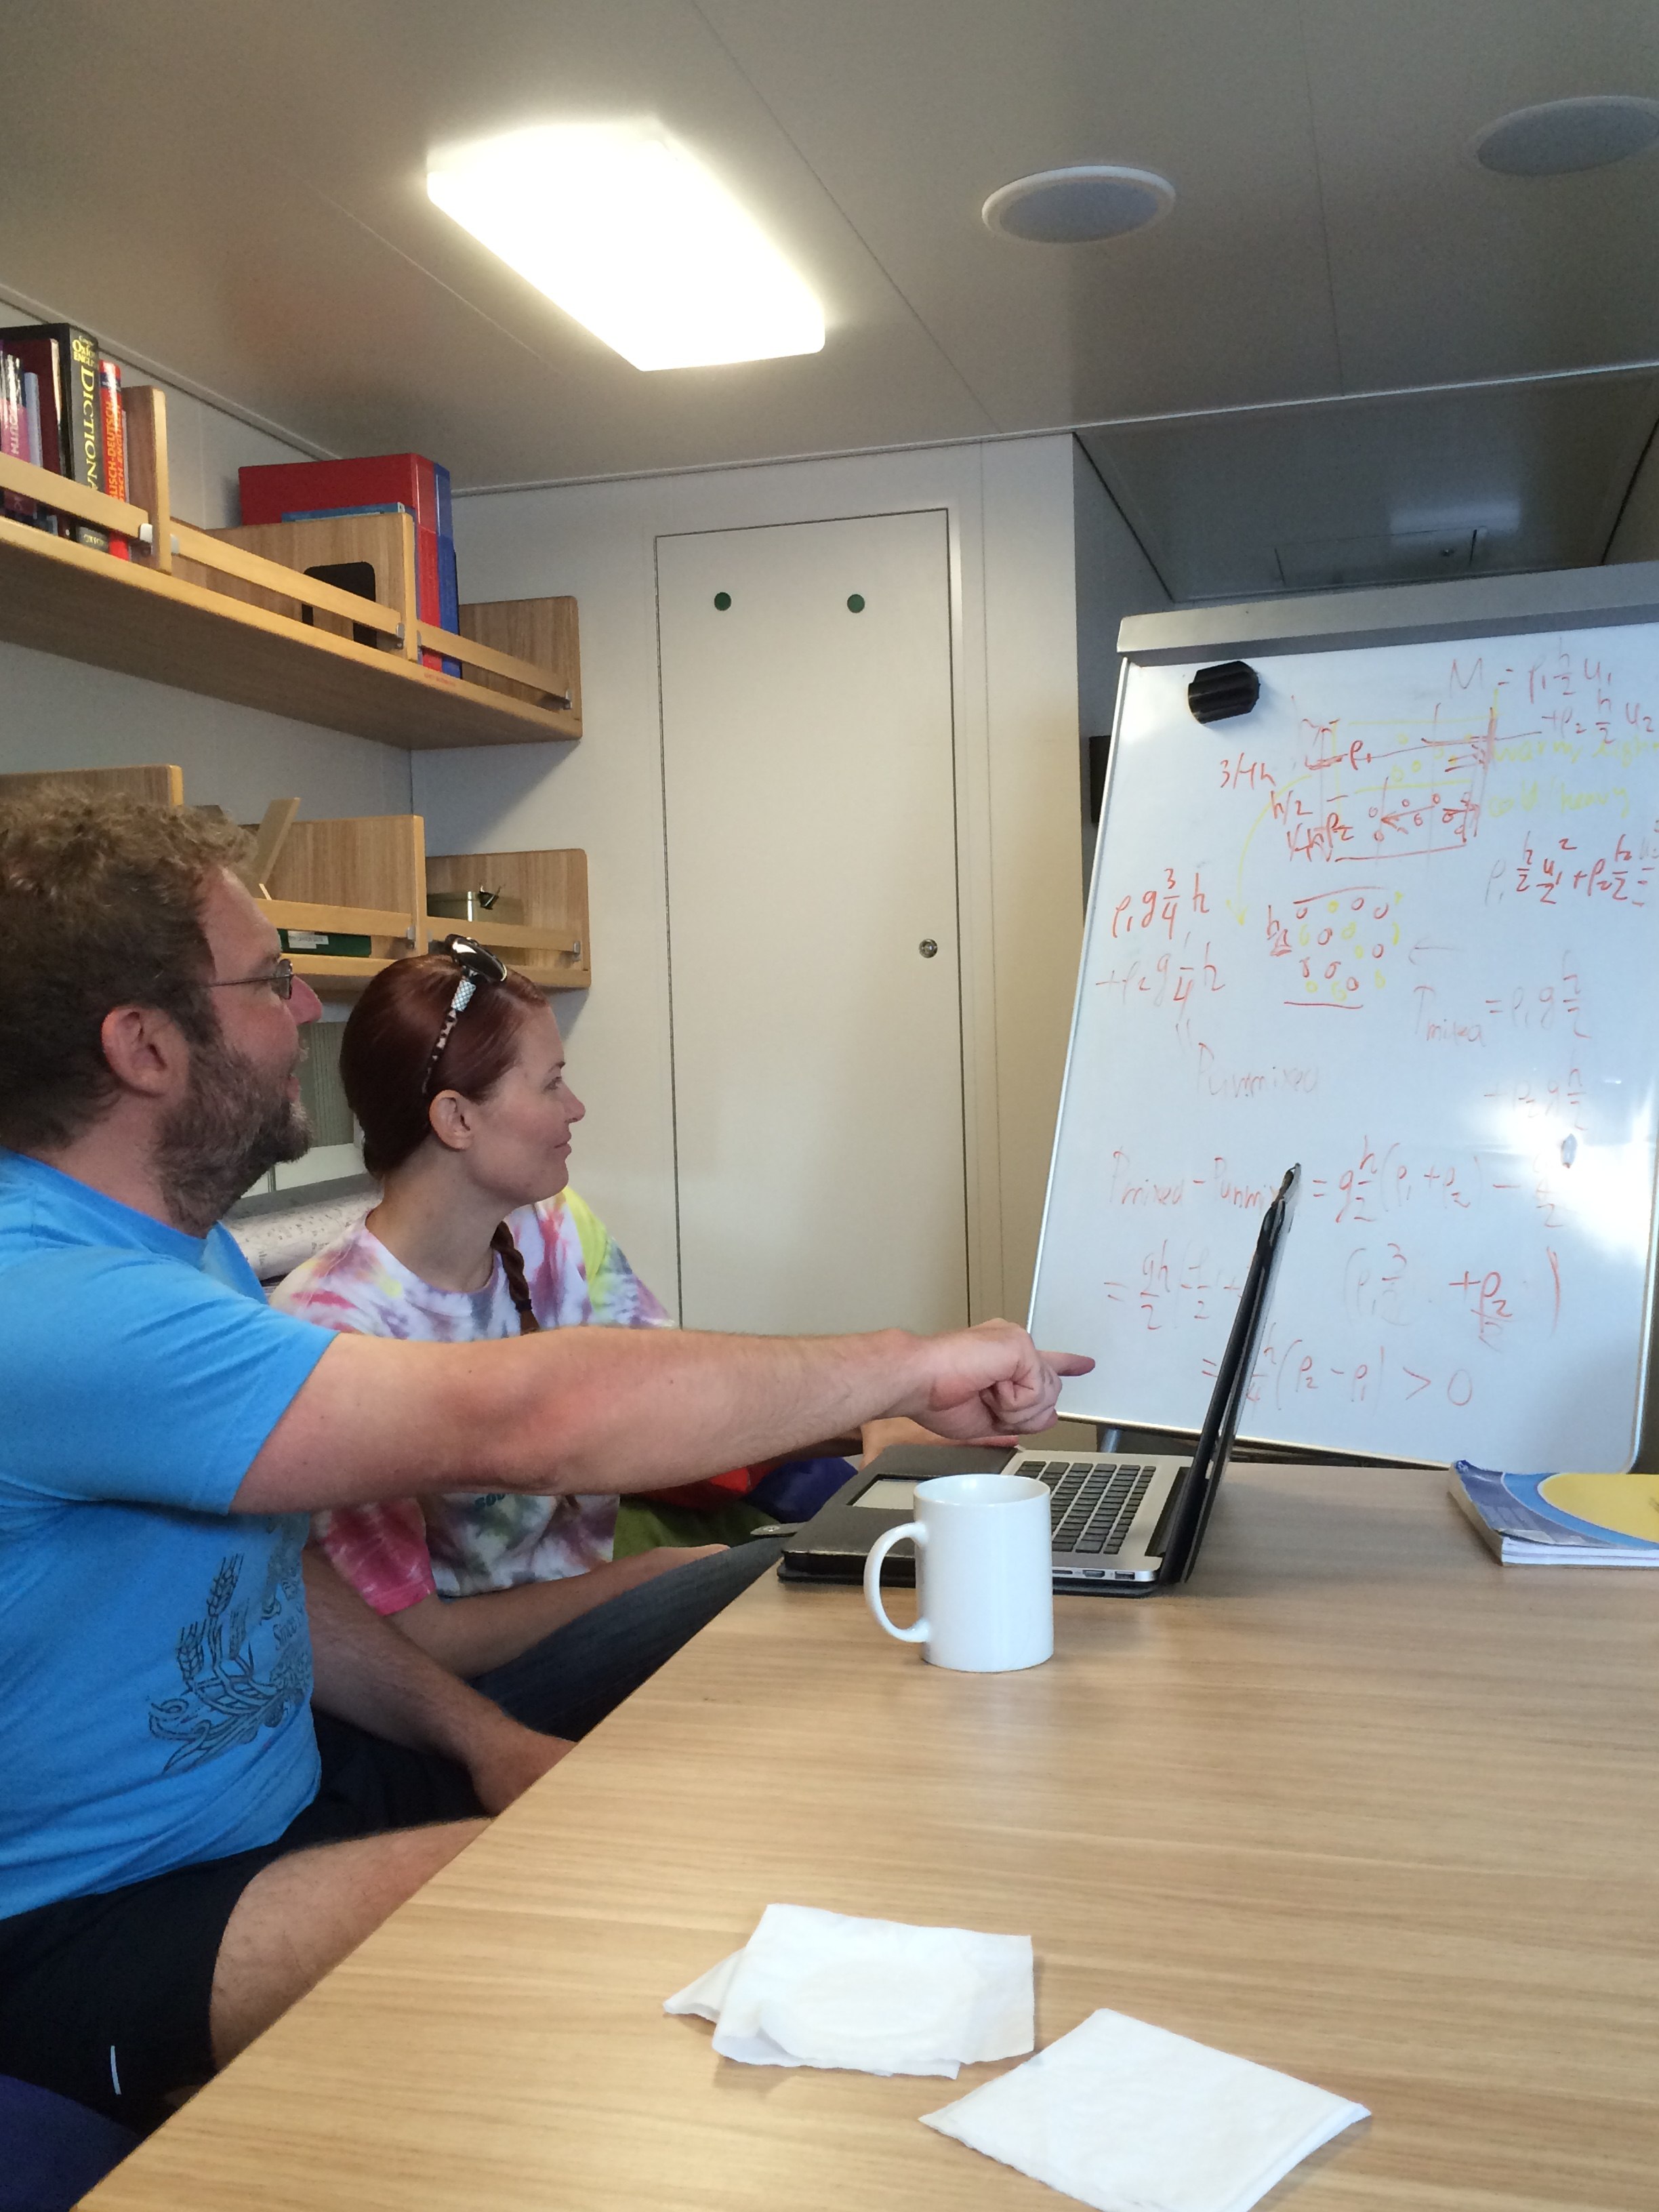
Unmixed layers have different centers of gravity—the depth in the middle of the layer. Mathematically, two layers of fluid can be considered mixed if their centers of gravity coincide. With some assistance from Dr. Andrei Natarov
The energy needed to move the centers of gravity is present within the two layers, because moving fluid has velocity and therefore, kinetic energy. However, kinetic energy can only sometimes be converted into potential energy. “For example,” says Dr. Natarov. “When both layers are moving at the same velocity, kinetic energy of the flow cannot be converted into potential energy, because momentum is not conserved.” This is an example of the absence of shear.
When we calculate mixing, the energy and momentum conservation laws must be satisfied. Shear, which by definition requires layers of different velocities, is necessary for converting kinetic energy into potential energy without violating the conservation of momentum. Ultimately, using the relative densities of adjacent layers of fluid, we can calculate how much energy is needed for mixing the layers.
The bottom line
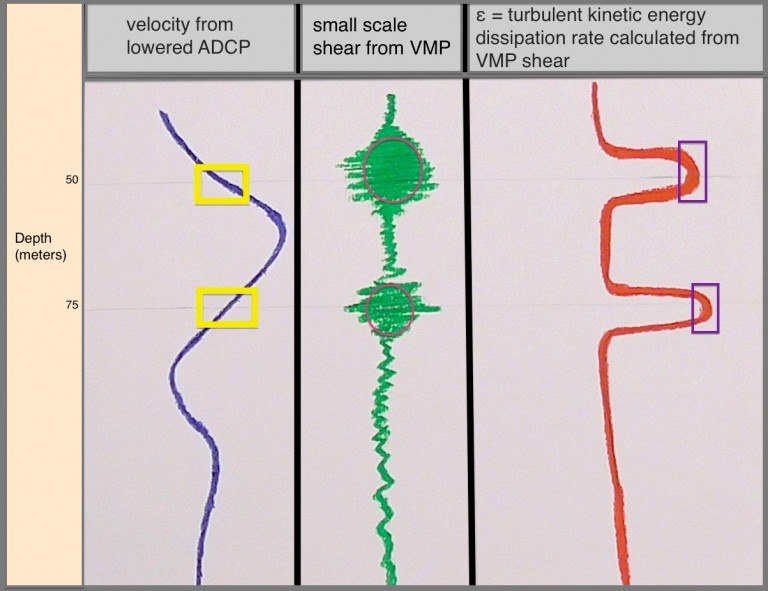
Large-scale shear produces flow instability, leading to turbulence, which causes mixing and therefore dissipation of energy. This is what the science team is after on this cruise. The Vertical Microstructure Profiler (VMP) measures the dissipation rate of the kinetic energy, i.e. the energy lost to the process, and provides the science team with a profile of shear on a much smaller scale than what they could measure on their own. Rapid velocity changes on a large-scale correlate with small-scale shear action and rapid energy dissipation at particular depths. The graph to the left helps visualize the difference between the small- and large-scale shear.
In the diagram to the right, the blue line represents current velocity as measured by the lowered ADCP, another instrument used on this cruise. The boxes on the blue line show where velocity changes rapidly, i.e., regions of large-scale shear. These regions correlate with areas of high shear activity as measured on a centimeter scale by the VMP, represented in green. The science team can then calculate the rate of turbulent kinetic energy dissipation (ε). The peaks diagramed in red, are considered to be a gauge of mixing (ε). Together, these provide a visual representation of the measurements being taken from Falkor and how shear relates to each instrument onboard.