We've Got Data!
The moment that all field scientists crave has arrived – preliminary data!



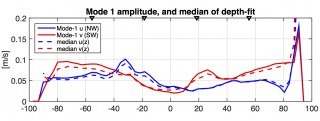
The midpoint of this transect marked the location of one of the moorings deployed by the Revelle. During this trek we traversed the transect six times and the shipboard ADCP collected water velocity data down to 800 meters depth. As we’ve discussed before, the ADCP measures current velocity in two orthogonal directions, North-South (the V-velocities) and East-West (the U-velocities). Taking these two directional velocities together gives a picture of the overall trajectory of the current. Remember that the internal tide is driven by the semi-diurnal tidal cycle and the tides move in a back and forth direction (like when the tide comes in and then goes back out on a beach). The semi-diurnal tide in the Tasman Sea should move bi-directionally along a NW – SE line
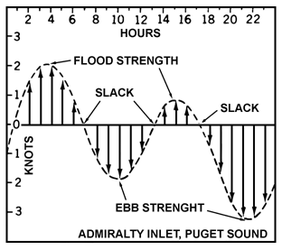
In addition, the velocities of the diurnal tide over time will fit on a sine curve
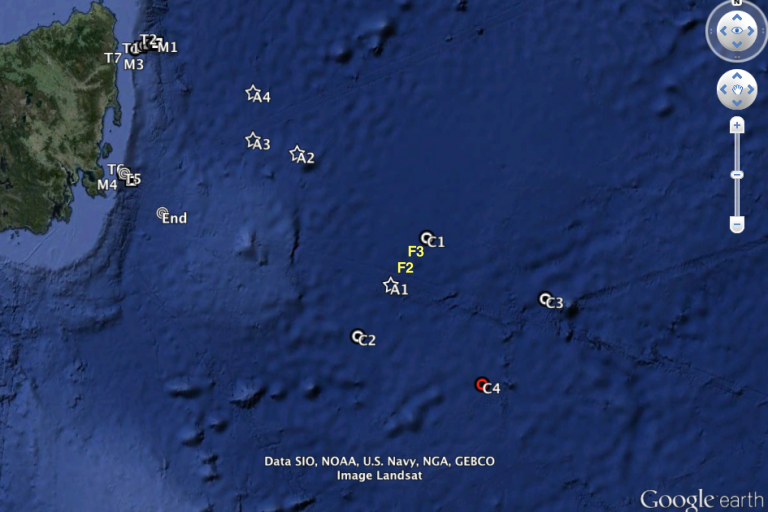
Another interesting development is that there is an area along the 200km transect that shows much higher velocities than the surrounding areas. This can be seen in a graphic called a contour plot, which uses color to visualize velocity and direction through the water column. In this contour plot, there is an area (*) where the velocity is very high (dark red/black). Could it represent the center of the T-Beam? We don’t know for sure just yet, but not surprisingly, this is the location that the science team decided to conduct the first full LADCP/CTD profile (F2). The second profile was located further north along the transect (F3). Each of these profiles was conducted over 30 hrs between the surface and 1700m depth, with a full cast (up and down) occurring every 2 hours. Those data now await further analysis, as the scientists decide their next move. At the moment, we are back in port for a few hours picking up some new equipment and preparing for another round of profiles.