


Dive In
About the Expedition
During the first leg of the Open Ocean to Inner Sea expedition, the Canadian research team collected basic oxygen and other measurements offshore of Vancouver Island.
- Dive Markers
- Trackline
The Mission
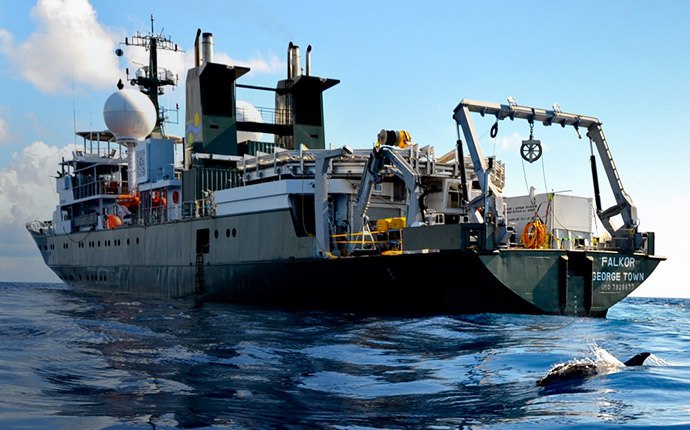
During the first leg of the Open Ocean to Inner Sea expedition, the Canadian research team worked from Falkor to collect basic oxygen and other measurements around and offshore from Vancouver Island that they need to better understand the paths that low-oxygen water takes as it moves inland.
One of the key gaps in current understanding is what happens between the NEPTUNE and VENUS observatories. For instance, the team can get data from NEPTUNE about when conditions are right for upwelling to bring more low-oxygen water onto the continental shelf. And data at the VENUS observatory in the Strait of Georgia can reveal when low-oxygen water has made its way well inland, where it is of the greatest concern because of potential harm to fisheries there.
But numerous open questions have remained about what happens in between those two sites. “The observatories are providing unprecedented measurements at fixed locations, but they’re not telling us the whole story,” says Richard Dewey, associate director for science, Ocean Networks Canada, and chief scientist for the expedition’s first leg.Researchers once thought of low-oxygen water intrusions inland as fairly uniform, but more recent research suggests that the water instead follows disjointed paths dictated by the topography of the seafloor. Specifically, rocky seafloor channels may effectively form submerged rivers or creeks of lower-oxygen water. The team focused their water measurements on the most likely pathways for these flows.
The data collected created a baseline against which future studies can compare to answer questions about the normal movements of low-oxygen water, and whether these intrusions are increasing, changing, or decreasing in coming years. This growing understanding will aid Canadians in better understanding their coastal waters, but should also offer insights about waters in other regions such as Washington and Oregon in the U.S. In keeping with the Schmidt Ocean Institute mission, all the data collected was made publicly available to aid other scientists in their related research efforts, and to provide the public with clear information about the region.
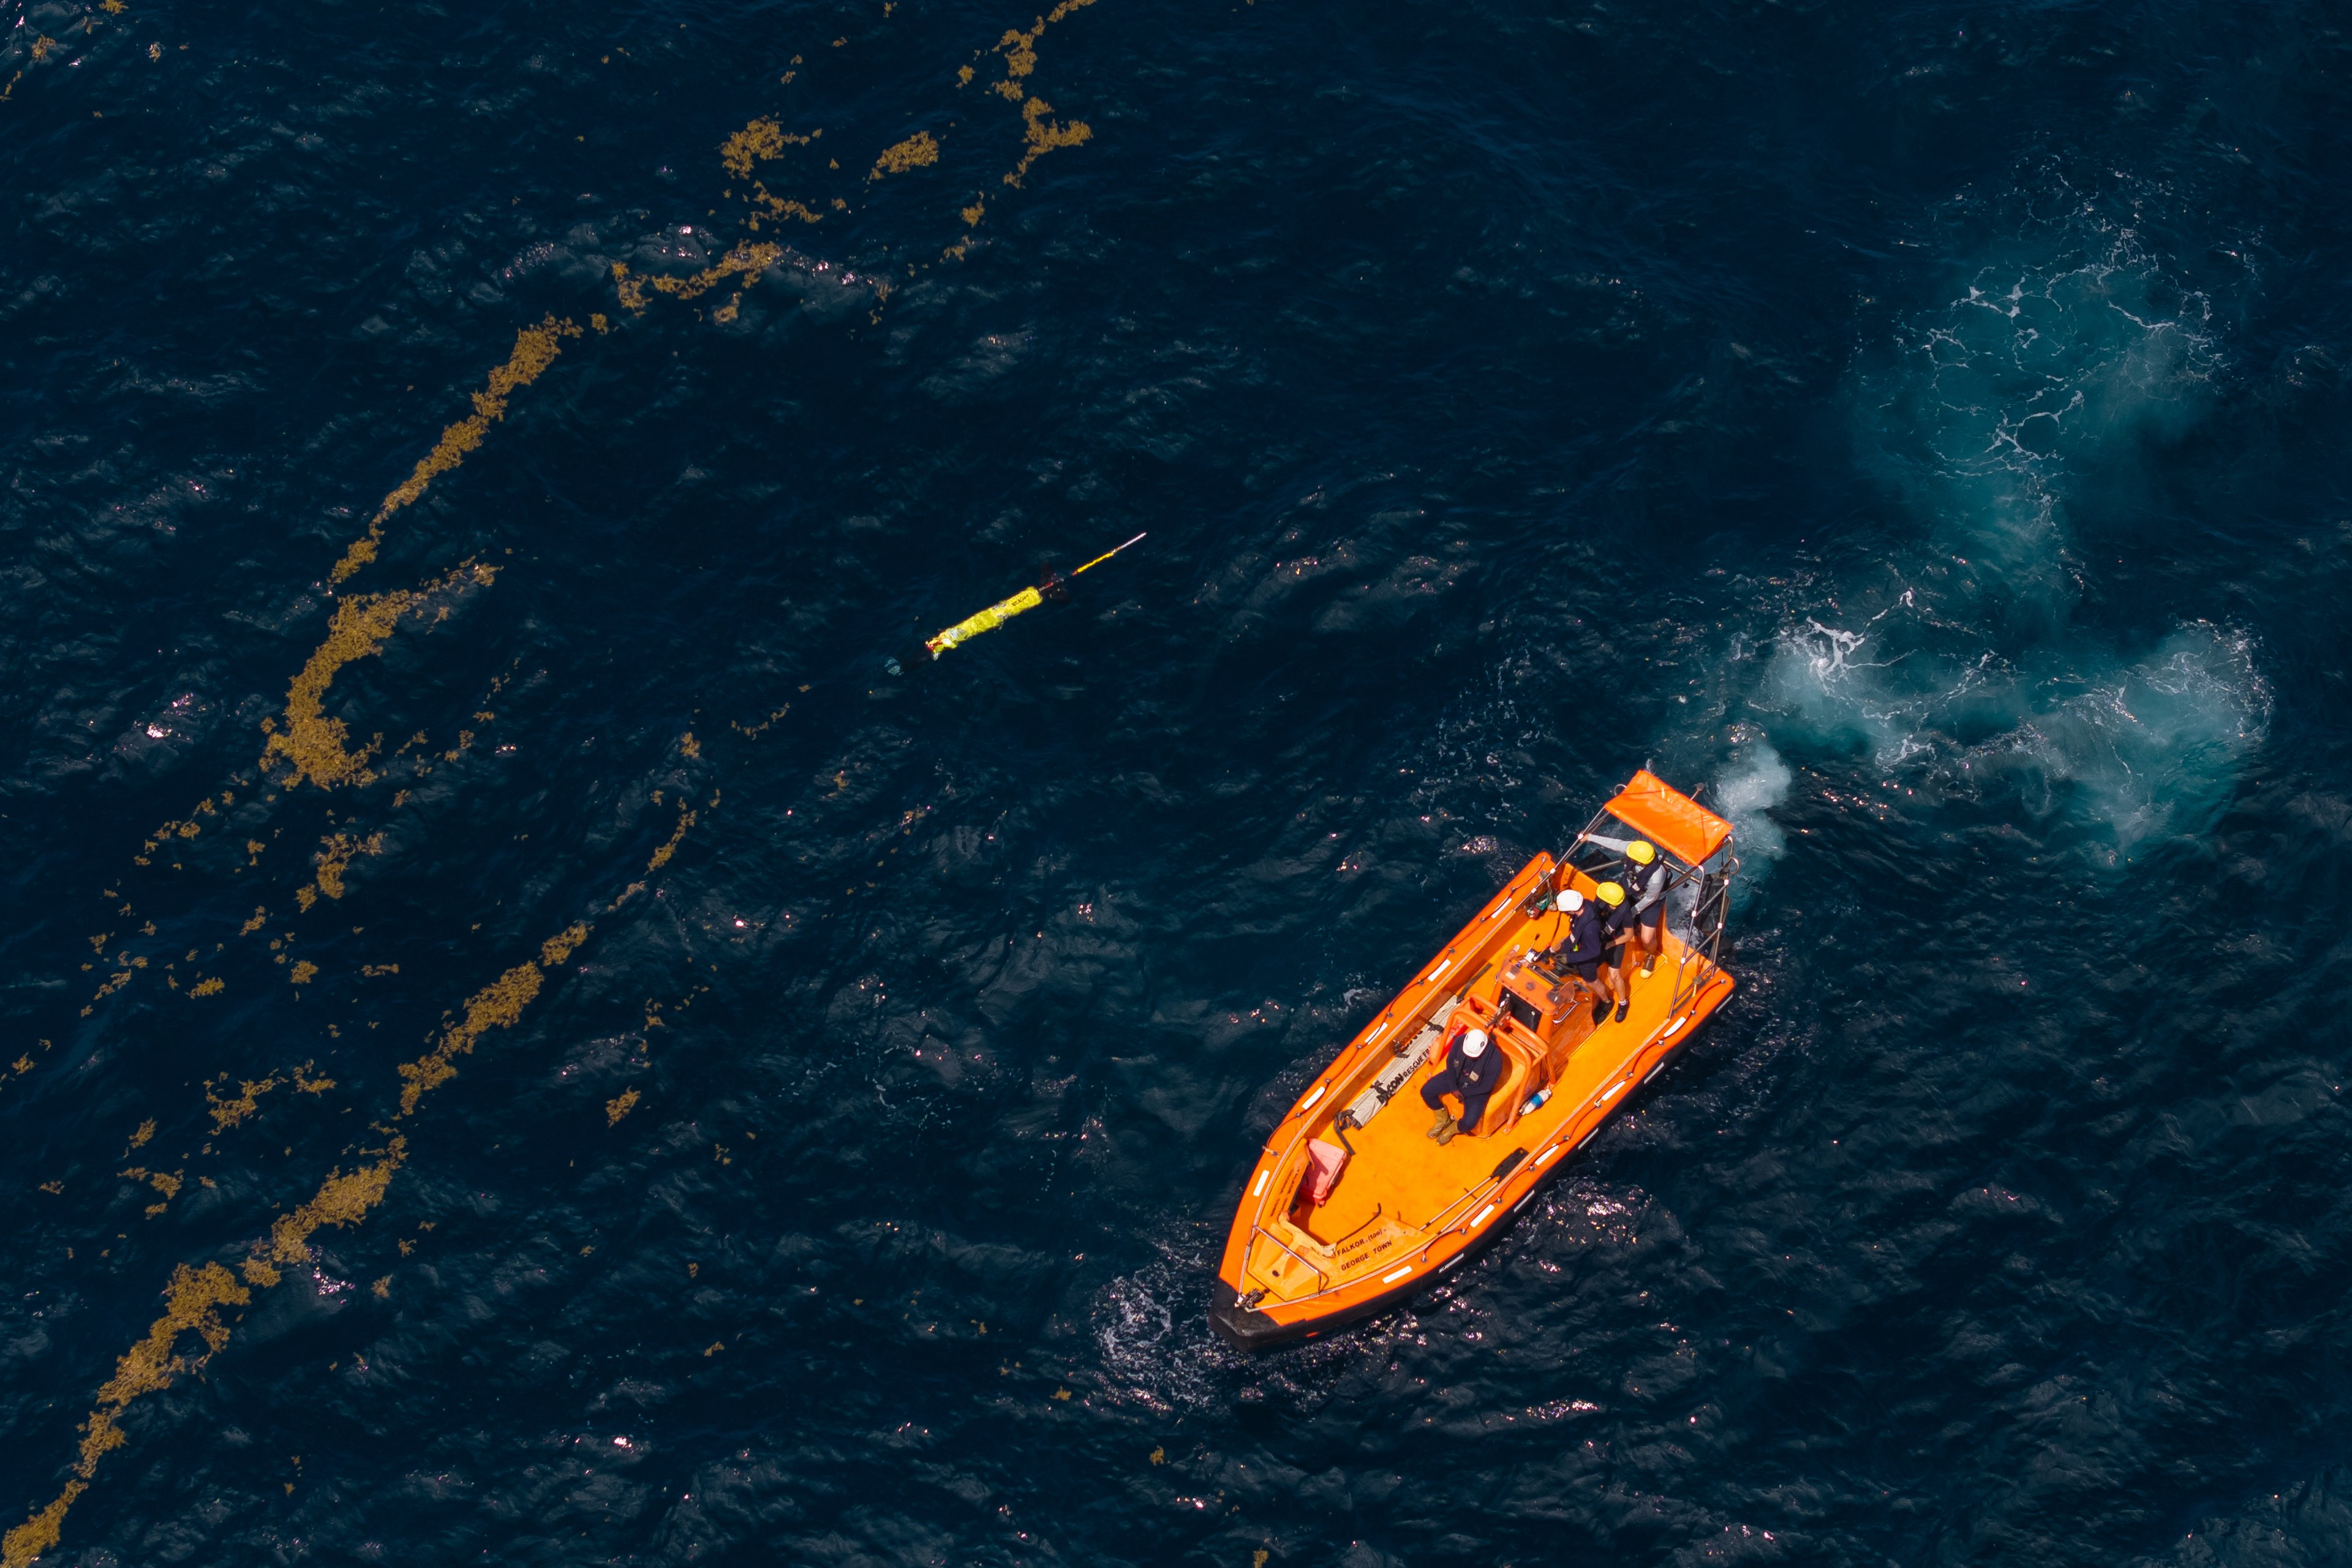
One of the most critical tools for the first leg was the Moving Vessel Profiler, an instrument equipped with oxygen and other sensors that the team will deploy behind Falkor. The MVP sends a constant stream of data back to the ship while it is moving, and researchers can raise and lower it in the water column like a yo-yo to characterize different depths.
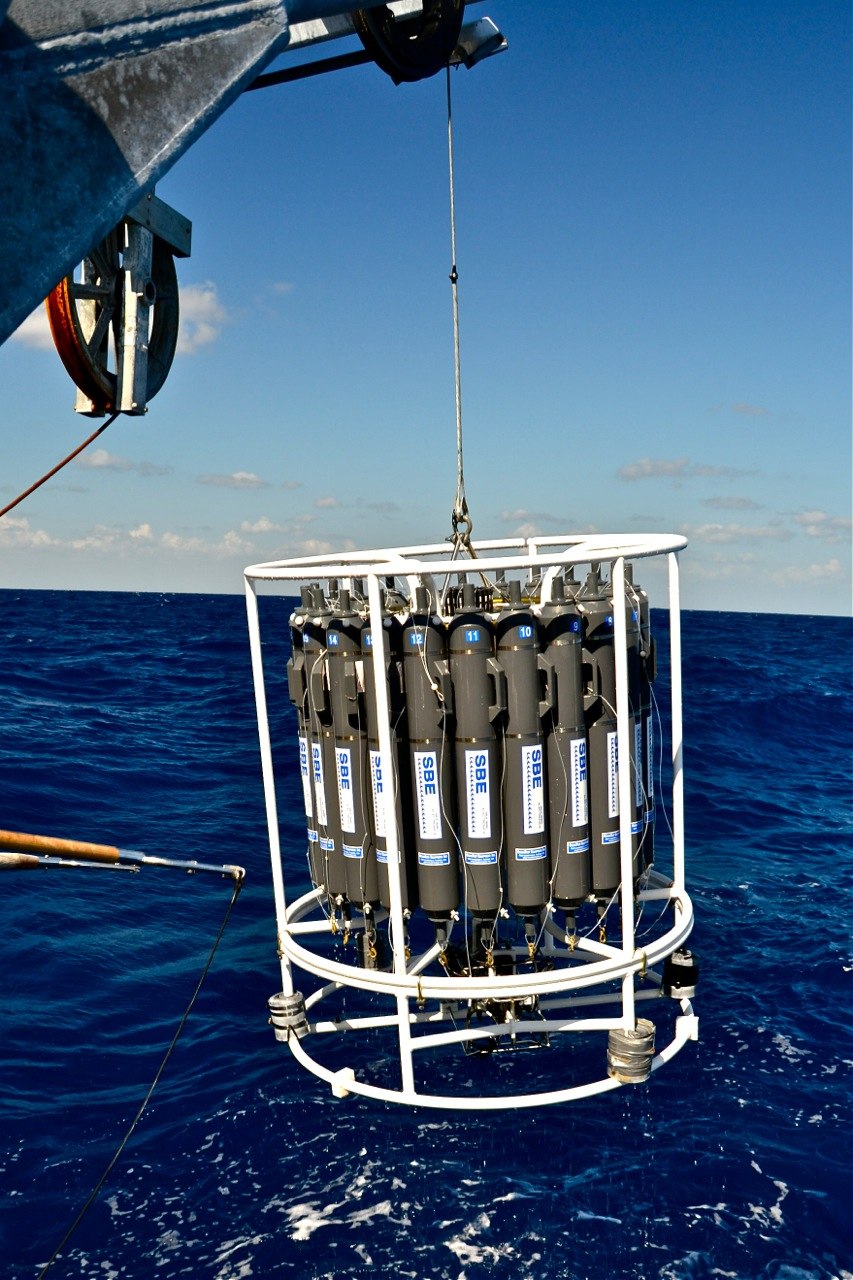
The team used the traditional method of stopping and lowering sampling bottles and sensors at single spots, for instance to test water samples for oxygen levels in Falkor’s lab to make sure equipment is properly calibrated, but the MVP allows for much more efficient studies of large areas than would be possible otherwise.
To augment this basic chemical data collection, the team also used Falkor’s sonar system to map the bottom topography that controls water movement, quantify the plankton and fish present in areas studied, and measured currents in the regions. “What we really appreciate about Falkor is that it comes with this very advanced suite of acoustic sampling capabilities,” says Dewey.
Finally, the team collected a number of moored sensors they deployed about six months previous in preparation for the Falkor expedition. These sensors collected some of the same oxygen and other data gathered at the observatories, but they are not wired to land. That means that researchers had to retrieve them in order to get data from them, but this offered a multi-month record of water movements and conditions that added to the baseline picture the team created of what is happening between the observatories.


Team and Collaborators








Explore
Updates from the Ship
All Ship Updates
- 01
Intermission
1 September 2013
Read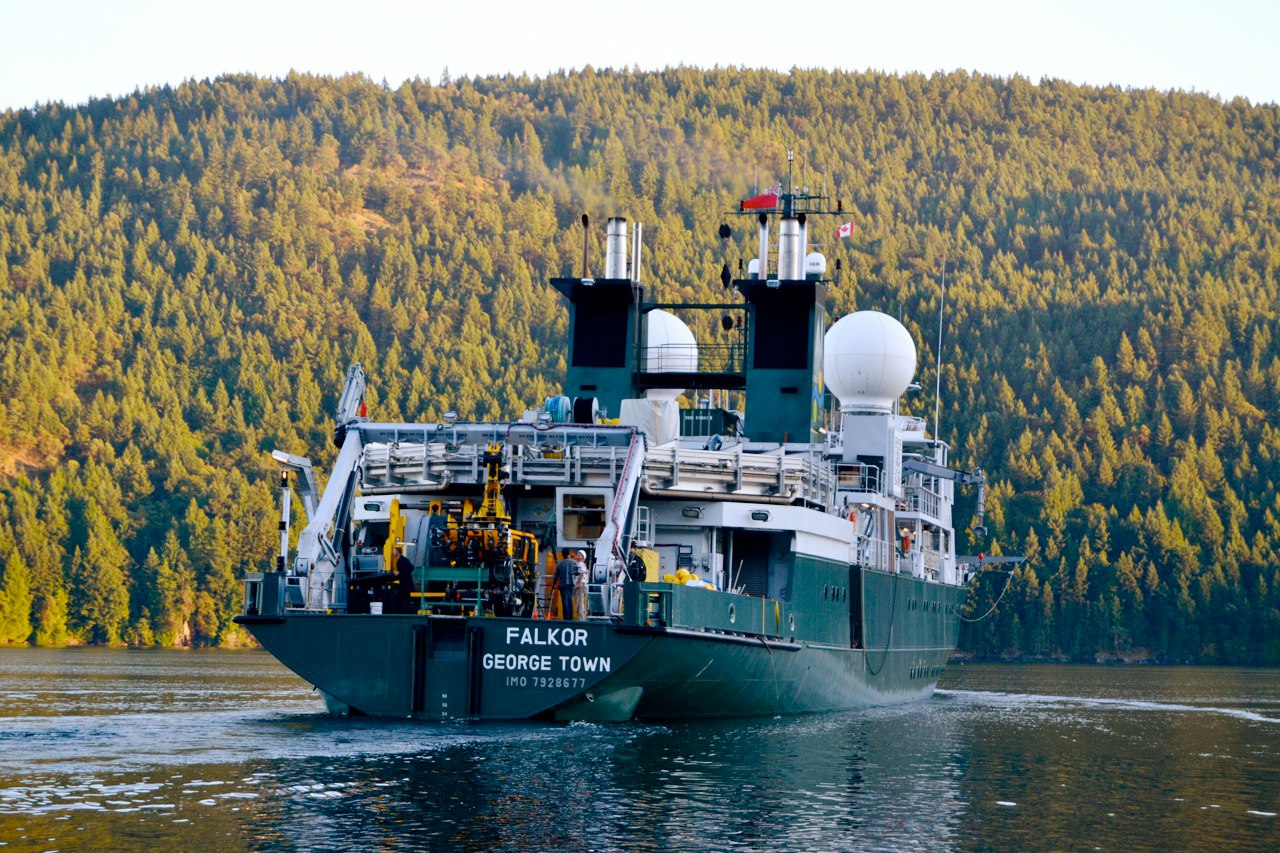
- 02
Almost Home
30 August 2013
Read
- 03
Free Explorers
29 August 2013
Read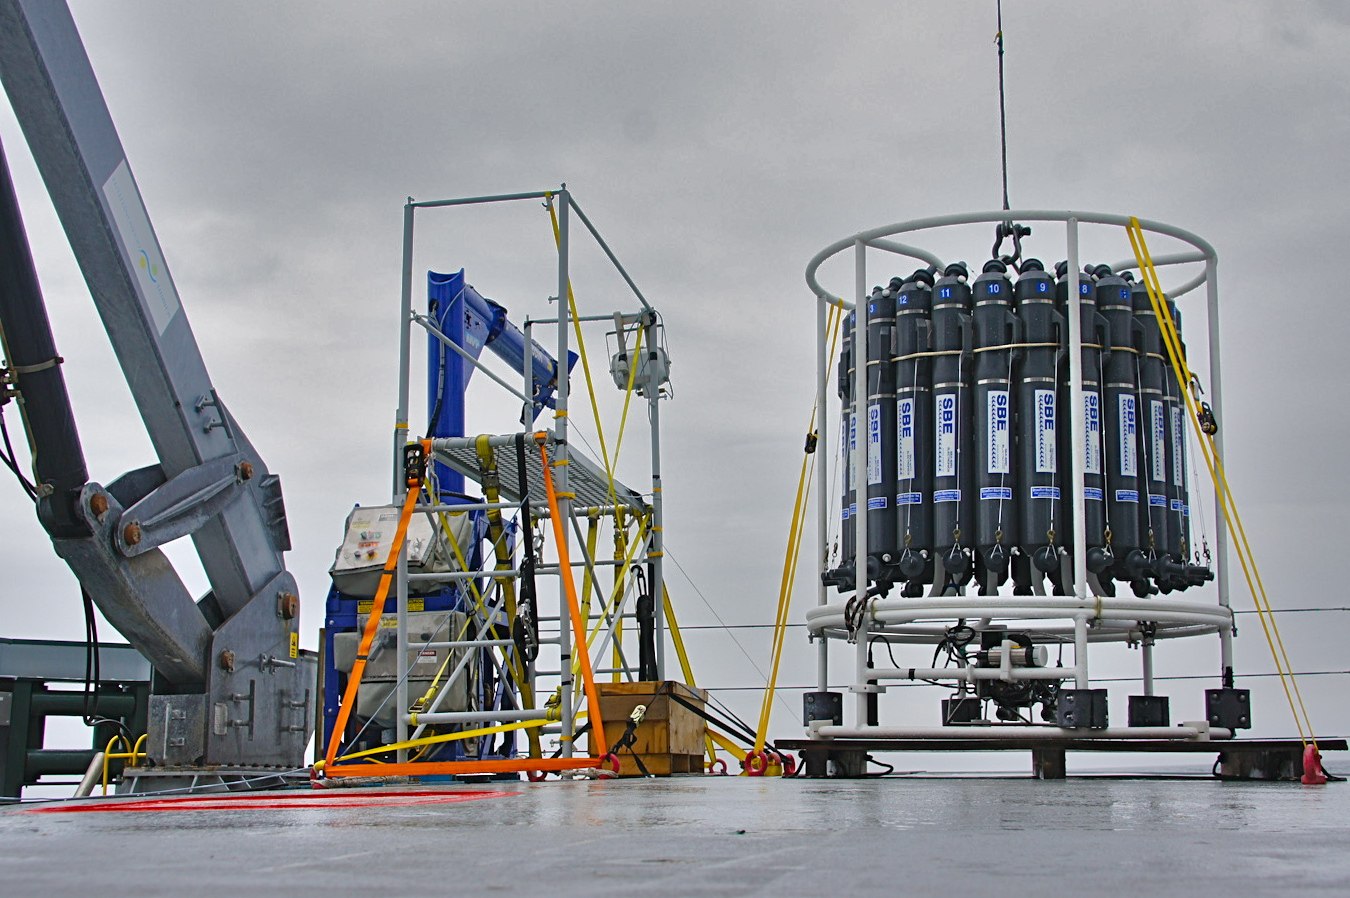
- 04
A Chief Scientist's Thoughts on Falkor
28 August 2013
Read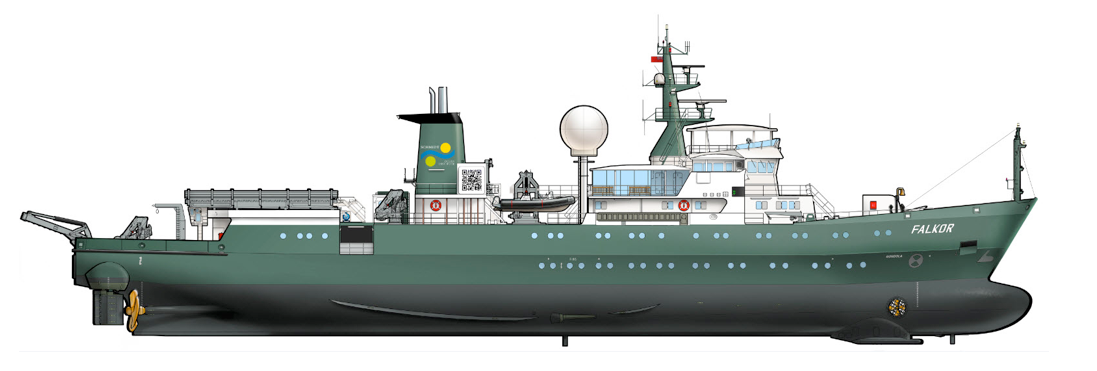
- 05
A Rougher Shade of Blue
27 August 2013
Read
- 06
Over the Ridge
26 August 2013
Read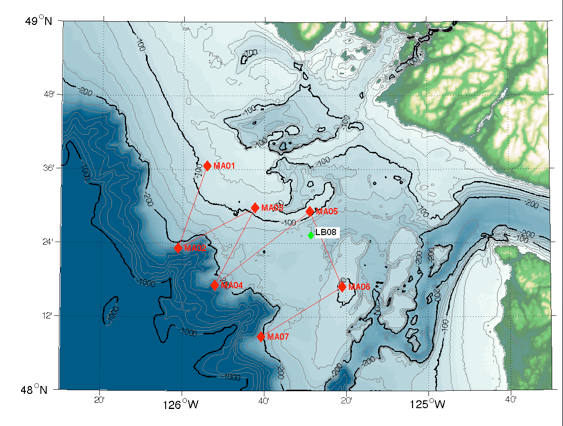
- 07
California Diversion
24 August 2013
Read
- 08
Coming Into Focus
23 August 2013
Read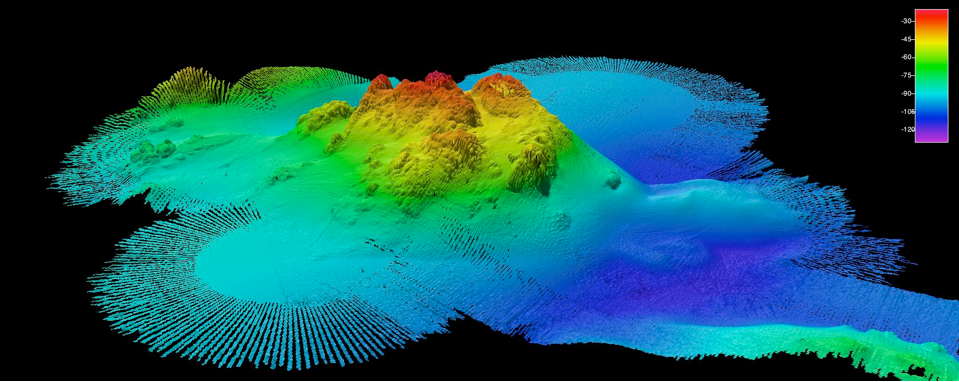
- 09
In Through the Out Door
22 August 2013
Read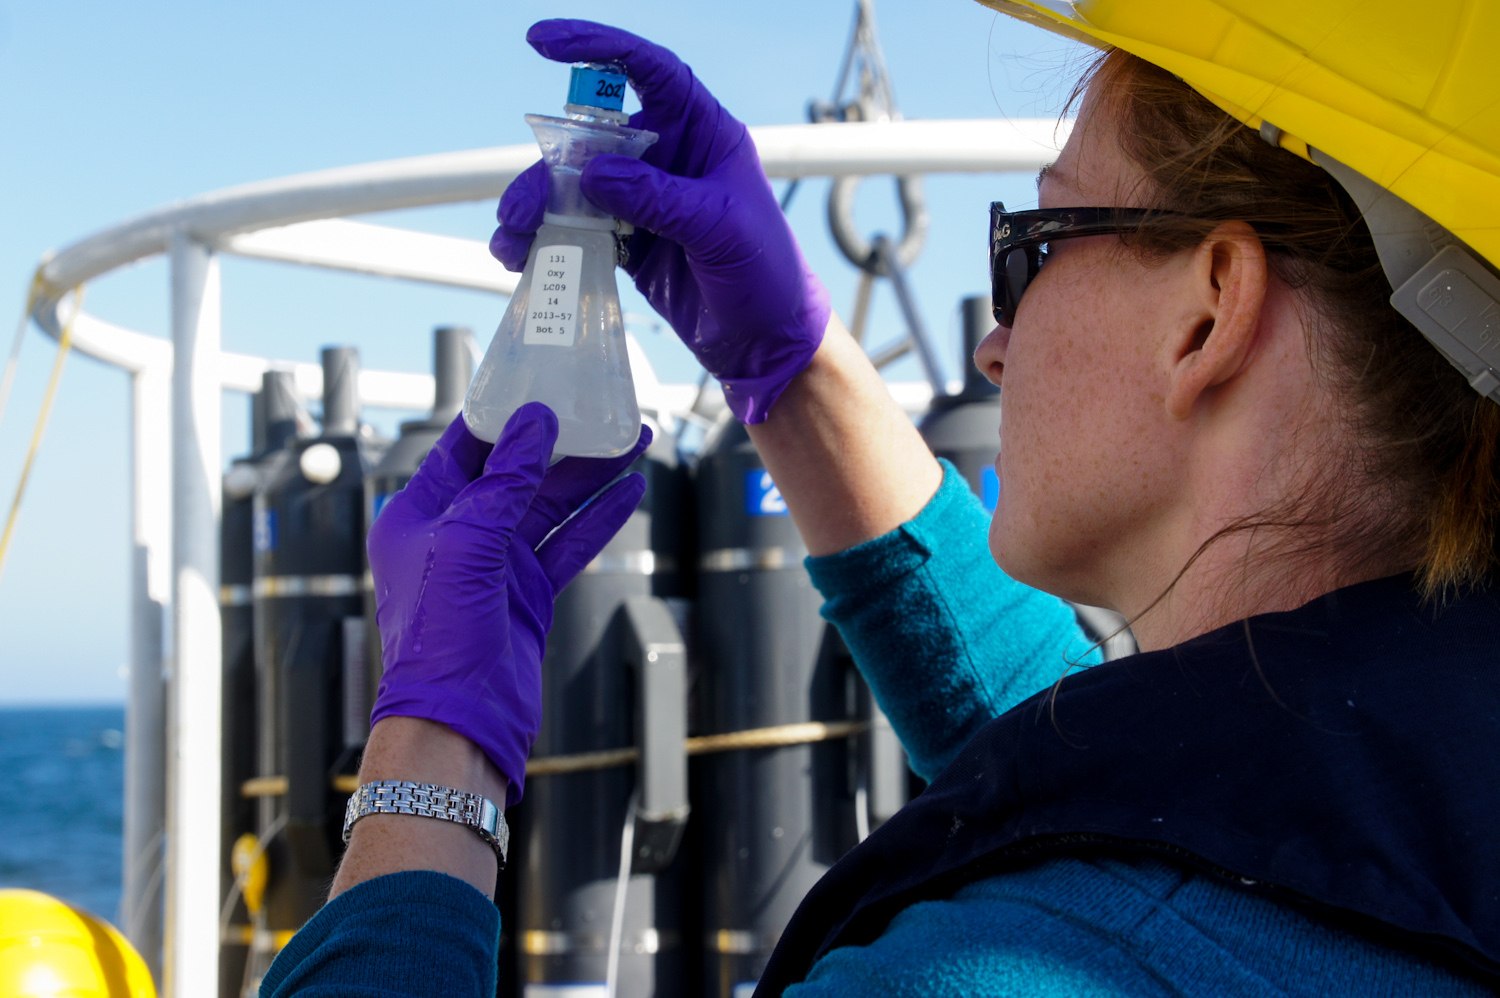
- 10
At the Source
21 August 2013
Read
- 11
Up, Down, Do it Again
20 August 2013
Read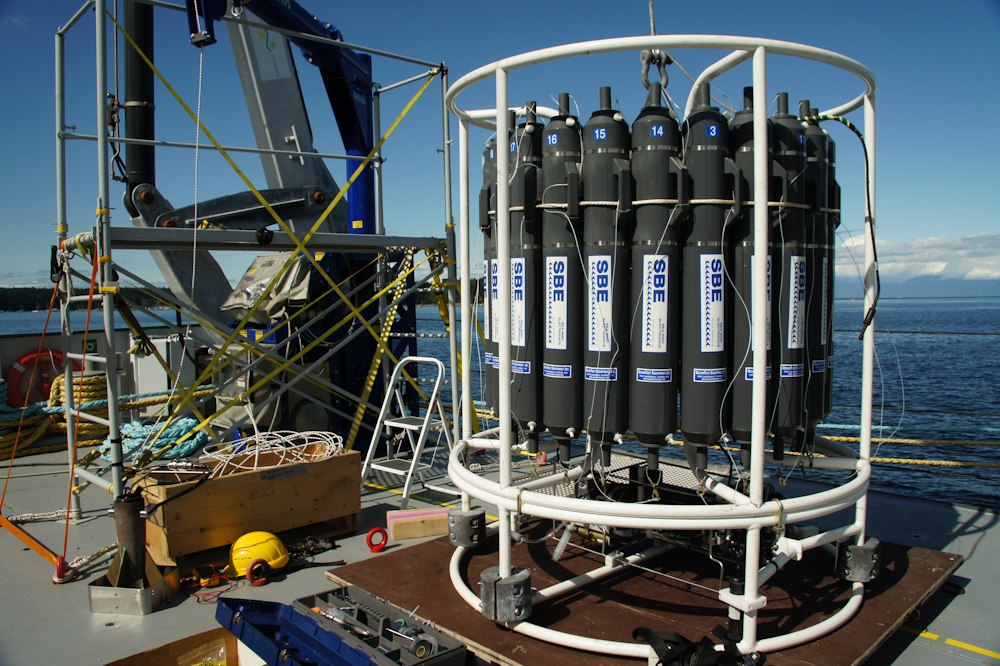
- 12
Away
19 August 2013
Read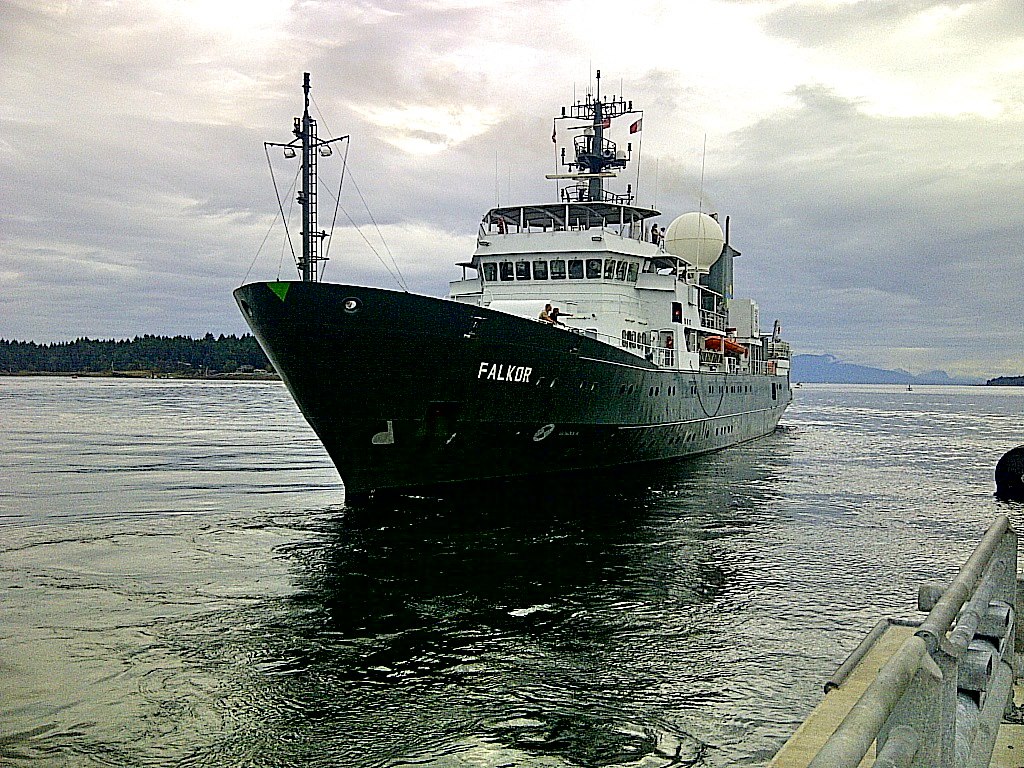
Discover More
Expedition Data
Title  | Type | Repository |
|---|---|---|
| CTD profiles, and recorded data from autonomous moorings | Oceanographic Property Data | Rolling Deck to Repository (R2R) |
Complete Cruise data is available through Ocean Networks Canada. You will need to create an account to login to retrieve the data. To access, click on the Data Search tab, then on Ship Data, and select R/V Falkor. Data available for download includes: Multibeam (EM302, EM710), ADC, Echosounder– bioacoustics, Fluorometer, Navigation, Oxygen sensor, Sound speed sensor, Sub-bottom profiler, Temperature sensor, Thermosalinograph, Vertical profiler system, and various sensors. | Sonar Data, Navigation Data, Oceanographic Property Data | Ocean Networks Canada |
| Vessel Underway data | Oceanographic Property Data | Rolling Deck to Repository (R2R) |
Publications from This Expedition
Cruise Report: Open Ocean to Inner Sea
Klymak, Jody, Susan Allen, Richard Dewey, Stephanie Waterman, Rich Pawlowicz & Steven Mihaly. (2014).Evidence for cross-shelf exchange catalyzed by a coastal canyon. Poster Presentation at Canadian Meteorological and Oceanographic Society, Rimouski, Quebec, Canada.
Smith, J. (2017). What Lies Beneath? Mapping the Marine Monuments of the Pacific. Public Lecture, Hanauma Bay Educational Lecture Series, Honolulu, HI, USA.
Sahu, S. (2019). Characterizing the lowest oxygen waters on the southern continental shelf off Vancouver Island. MSc Thesis, University of British Columbia.
Klymak, J., Allen, S., and Waterman, S. (2023). Separation of an Upwelling Current Bounding the Juan de Fuca Eddy. JGR Oceans, 128 (8), doi: 10.1029/2023JC019688.
[This Article was published OPEN ACCESS]